Business Activity Monitoring on Azure Logic Apps with Azure Log Analytics
Introduction
Azure Logic Apps provide built-in monitoring tools that allow you to check the run history (including all inputs and outputs of triggers and actions), trigger history, status, performance, etc. Additionally, you can enable diagnostic logging on your Logic Apps and send all these runtime details and events to Azure Log Analytics. You can also install the Logic Apps Management Solution on OMS, which gives you a very rich aggregated view and charts of all your logic apps that are being monitored.
All these tools are great for developers or system administrators, who want to monitor and troubleshoot the execution of the workflows. However, sometimes we need to track and monitor more business-related information. Additionally, it’s quite common that business users want to monitor, with a business perspective, what’s happening at the integration layer.
In this post, I will show how to implement tracking capabilities for business-related information and how to create a Business Activity Monitoring (BAM) dashboard for Logic Apps.
Scenario
In a previous post, I introduced a fictitious company called “Farm to Table”, which provides fresh produce drone delivery. This company has been leveraging Logic Apps to implement their business processes, which integrate with multiple systems on the cloud. As part of their requirements they need to monitor the business activity flowing through this integration solution.
“Farm to Table” want to be able to monitor the orders they are receiving per channel. At the moment, customers can place orders via SMS, a web online store, and a mobile app. They also want to be able to track orders placed using customer number and order number.
Solution
Prerequisites
To be able to track and monitor business properties and activity on Logic Apps, there are some prerequisites:
- Azure Log Analytics workspace. We require an Azure Log Analytics workspace. We can use a workspace previously created or create a new one following the steps described here.
- Enable diagnostic logging to Azure Log Analytics on the Logic App which processes the messages we want to track, following the instructions detailed here.
- Install the Logic App Management solution for OMS on the Azure Log Analytics.
Adding Tracking Properties to the Logic App Workflow
Once enabled diagnostic logging, by default, Logic Apps tracks all workflow instances and actions on Azure Log Analytics. This tracking can very easily be extended using Tracked Properties on the workflow actions. In the tracked properties, we can include business related data; for example, in this scenario we could track customer Id, order number, order total, and channel.
“Farm To Table” has implemented an HTTP Triggered Logic App workflow that receives orders from different channels, validates the orders, maps it to a canonical model, enriches the message, and then puts them into a Service Bus Queue. The order canonical model processed by this workflow follows the schema of the instance below:
To track business properties of the orders, we will add the tracked properties to the action that sends the message to Service Bus. It’s noteworthy that when we use tracked properties within a Logic App action, we can only use the trigger input and the action’s inputs and outputs.
In the Logic App action that sends the message into a Service Bus queue, we will add the tracked properties to include the customer Id, order number, order Total, date, and channel. I’m also adding a flag to simplify my queries, but that’s optional. The code below shows the trackedProperties section added to our workflow action.
Once we have started tracking those properties and we have information already logged on Azure Log Analytics, we can start querying and creating charts for our own Business Activity Monitoring Dashboard.
Querying Azure Log Analytics
Let’s start querying what we are tracking from the Logic Apps on Log Analytics. Bear in mind that there is a delay between the execution of the Logic App and the log being available on Log Analytics. Based on my experience, it usually takes anywhere between 2 and 10 minutes. You can find detailed documentation on the Log Analytics query language here.
The query below returns the custom data I’m tracking on the Logic App workflow. When building your queries, it’s worth noting that
- Workflow actions are being logged using the AzureDiagnostics Log Type and with the WorkflowRuntime category.
- Logic Apps prepend the prefix "trackedProperties_" to each property and append a suffix to declare its type.
This query should return a result set as the one below:
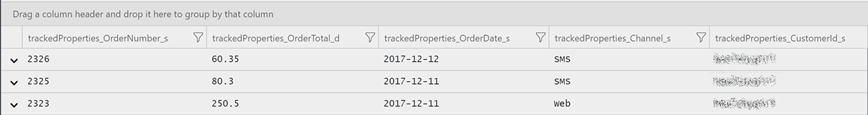
Additionally, we can add filters to our queries, for instance, to get all orders by the CustomerId, we could use a query as follows:
Creating a Monitoring Dashboard.
Before, Microsoft suggested to create OMS custom views and queries for this purpose. The steps to create a custom OMS dashboard for Logic Apps are described here. However, after the upgrade of OMS to the new Log Analytics Query Language (previously known as Kusto query language), the recommended approach is now to use the new Azure Log Analytics portal, create queries and charts, and pin them to a shared Azure Dashboard. If have created both, custom OMS dahsboards and custom Log Analytics Azure Dashboards, you must agree that shared Azure Dashboards and Log Analytics charts are much more user friendly.
The steps to create and shared an Azure Dashboard to include Log Analytics data and charts are described here. We will follow these steps to create our own Business Activity Monitoring Dashboard as a shared Azure Dashboard. I won’t repeat what’s in Microsoft’s documentation, I’ll just show how I’m creating the charts to be added in the Dashboard.
Order Count by Channel
“Farm to Table” want to have a chart with the order count summarised by channel for the last 7 days in their BAM Dashboard. The query below returns those details.
Once we get the results, we need to select Chart and then the Doughnut option. After that, we are ready to pin our chart to the Azure shared dashboard.
Order Total by Date and Channel
The company also want to have a chart with the order total summarised by date and channel for the last 7 days in their Dashboard. The query below returns those details.
Once we get the results, we need to select Chart and then Stacked Columns. After that, we are ready to pin our chart to the Azure shared dashboard.
Business Activity Monitoring Dashboard
Once we have pinned our charts, we would be able to see them in our Azure shared dashboard. These charts are very handy and allow us to dynamically visualise the data as shown below.
Wrapping-up
In this post, we’ve seen how to easily track and monitor business information flowing through our Logic Apps, using Logic App native integration with OMS and Azure Log Analytics. Additionally, we’ve seen how friendly and cool the Log Analytics charts are. This gives Logic Apps another great competitive advantage as an enterprise-grade integration Platform as a Service (iPaaS) in the market.
I hope you’ve learned something useful and enjoyed this post! Feel free to post your comments or questions below
Happy clouding!
Paco
Follow me on @pacodelacruz
Cross-posted on Deloitte Engineering Blog