Custom Distributed Tracing and Observability Practices in Azure Functions – Part 2 - Solution Design

Introduction
In my previous post, I discussed why it is important to consider traceability and observability practices when we are designing distributed services, particularly when these are executed in the background with no user interaction. I also covered common requirements from an operations team supporting this type of services and described the scenario we are going to use in our sample implementation. In this post, I will cover the detailed design of the proposed solution using Azure Functions, Application Insights, and other related services. As mentioned in that post, I’ll be using the publish-subscribe pattern, but this approach can be tailored for other types of scenarios.
This post is part of a series outlined below:
- Introduction – describes the scenario and why we might need custom distributed tracing in our solution.
- Solution design (this article) – outlines the detailed design of the suggested solution.
- Implementation – covers how this is implemented using Azure Functions and Application Insights.
Tracing Spans
In my previous post, we discussed common requirements of operations teams and identified what features we can include in our solution to meet them. Let’s now think in more detail about how we want to meet these requirements in our solution. By following some of the concepts of the OpenTracing specification, we can say that the scenario described in my previous post could be composed of the tracing spans depicted below:
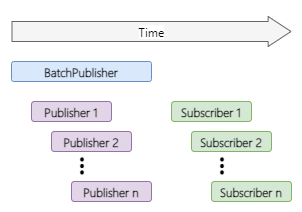
- BatchPublisher: unit of work related to receiving a batch of events, splitting the batch, and publishing individual messages to a queue.
- Publisher (1-n): unit of work that receives individual messages, does the corresponding processing (e.g. message validation, transformation), and publishes the message to a queue. The Publisher spans are ChildOf the BatchPublisher
- Subscriber (1-n): unit of work that subscribes to individual messages in the queue, does the corresponding processing (e.g. message validation, transformation), and delivers the message to the target system. A Subscriber span FollowsFrom a Publisher
Structured Logging Key-Value Pairs
After defining the relevant tracing spans, let’s determine what we want to log as part of our tracing events. We are going to use structured logging with key-value pairs to be able to query, filter, analyse and comprehend our tracing data. The proposed key-value pairs are described in the table below, each with a defined scope. Those key-value pairs with a cross-span scope follow the concept of baggage items; meaning that the same value is preserved across processes or tracing spans for the traced entity. A span scope follows the concept of span tags, which means that the same value is kept throughout the span for the traced entity. And those with scope log follow the log concept, meaning that the value is only relevant to the tracing event.
|
Key |
Description |
Scope |
|
BatchId |
Batch identifier to correlate individual messages to the original batch. It is highly recommended when using the splitter pattern. |
Cross-span |
|
CorrelationId |
Tracing correlation identifier of an individual message. |
Cross-span |
|
EntityType |
Business identifier of the message type being processed. This allows to filter or query tracing events for a particular entity type. E.g. UserEvent, PurchaseOrder, Invoice, etc. |
Cross-span |
|
EntityId |
Business identifier of the entity in the message. This together with the EntityType key-value pair allow to filter or query tracing events for messages related to a particular entity. E.g. UserId, PurchaseOrderNumber, InvoiceNumber, etc. |
Cross-span |
|
InterfaceId |
Business identifier of the interface. This allows to filter or query tracing events for a particular interface. Useful when an organisation defines identifiers for their integration interfaces. |
Span |
|
RecordCount |
Optional. Only applicable to batch events. Captures the number of individual messages or records that are present in the batch. |
Span |
|
DeliveryCount |
Optional. Only applicable to subscriber events of individual messages. Captures the number of times the message has been attempted to be delivered. It relies on the Service Bus message DeliveryCount property. |
Span |
|
LogLevel |
LogLevel as defined by Microsoft.Extensions.Logging |
Log |
|
SpanCheckpoint |
Defines the tracing span and whether it is the start or finish of it, e.g. PublisherStart or PublisherFinish. Having standard checkpoints allows correlating tracing events in a standard way. |
Log |
|
EventId |
Captures a specific tracing event that helps to query, analyse, and troubleshoot the solution with granularity. |
Log |
|
Status |
Stores the status of the tracing event, e.g., succeeded or failed |
Log |
Publisher Interface Detailed Design
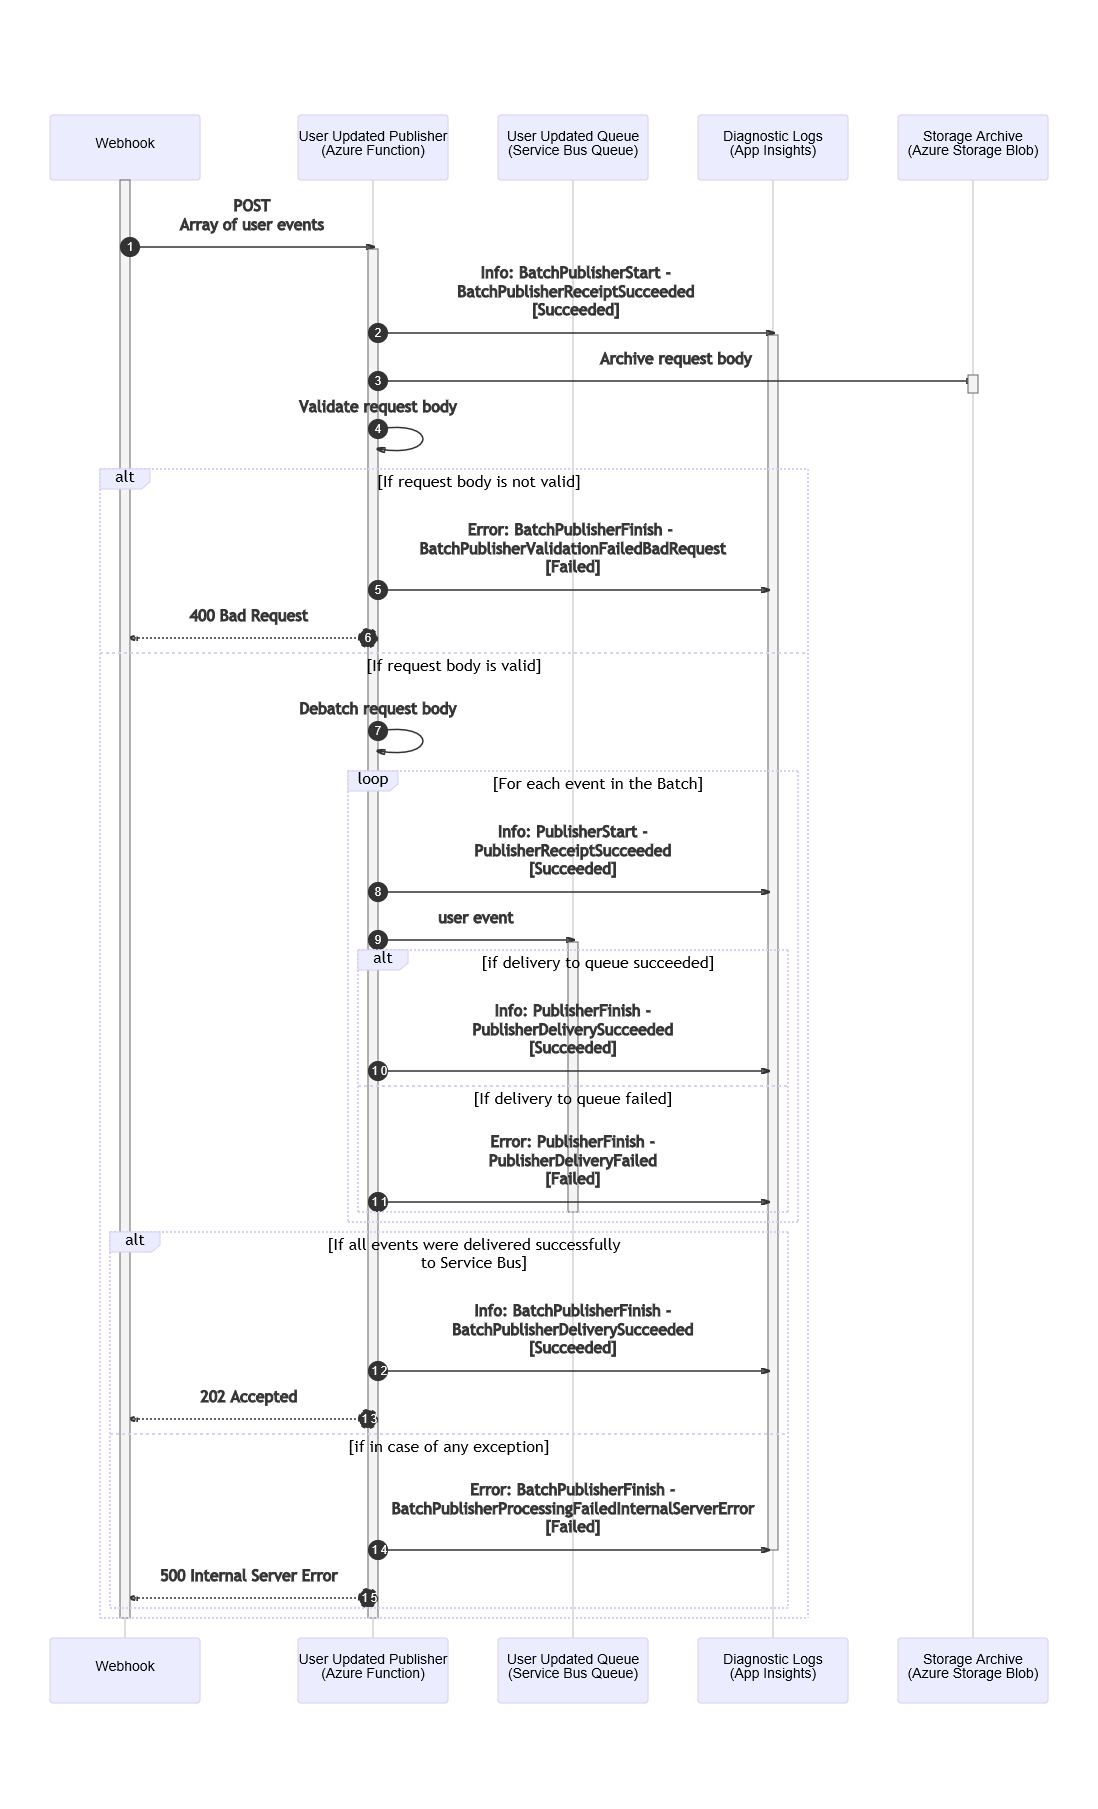
Let’s now consider how we are going to be implementing this in more detail as part of our integration interfaces. The BatchPublisher and Publisher spans will be implemented as one publisher interface/component. So now let’s cover how we want to implement the tracing and observability practices in this interface. We will use the sequence diagram below, which has the following participants:
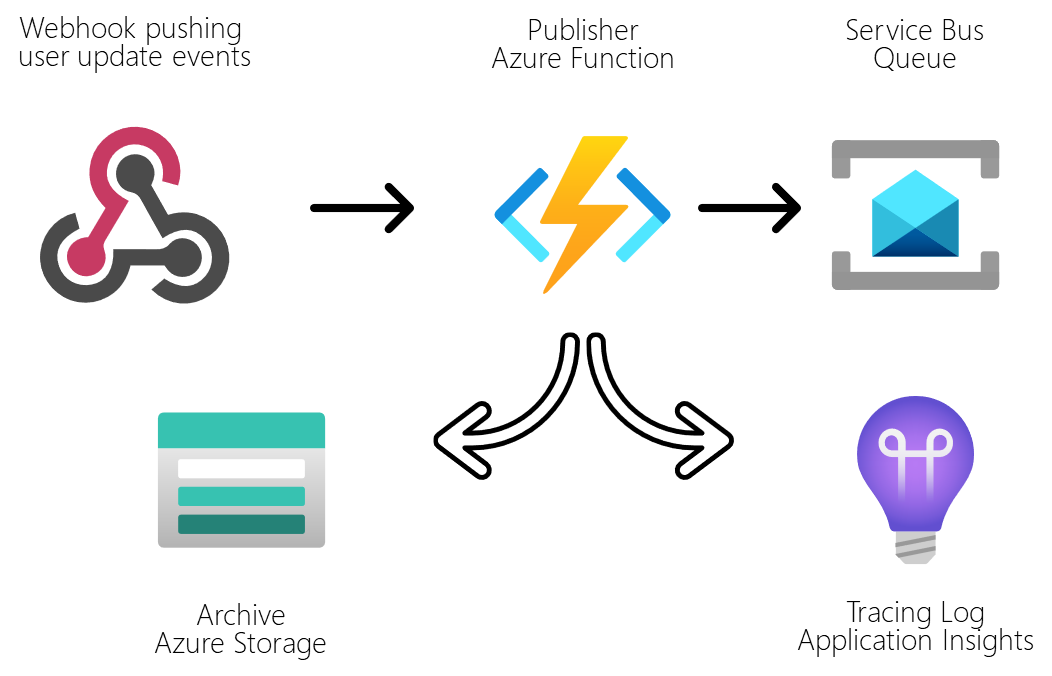
- Webhook - an HR or CRM system pushing user update events via webhooks, which sends an array of user events and expects a HTTP response.
- User Updated Publisher Azure Function - receives the HTTP POST request from the webhook, validates the batch message, splits the message into individual event messages, publishes the messages into a Service Bus queue, returns the corresponding HTTP response to the webhook, sends the relevant tracing logs to the Diagnostics Logs, and archives the initial request to Azure Storage.
- User Updated Service Bus queue - receives and stores individual user event messages for consumers.
- Diagnostic Logs in Application Insights - captures built-in telemetry and custom tracing produced by the Azure Functions.
- Storage Archive Azure Storage blob - stores request payloads.
The sequence diagram below is an expansion of the first part of the diagram shown in the previous post. In this, we are going to define in more detail the tracing events, including some relevant key-value pairs defined previously. Tracing log events are depicted using the convention: LogLevel: SpanCheckPointId - EventId [Status].
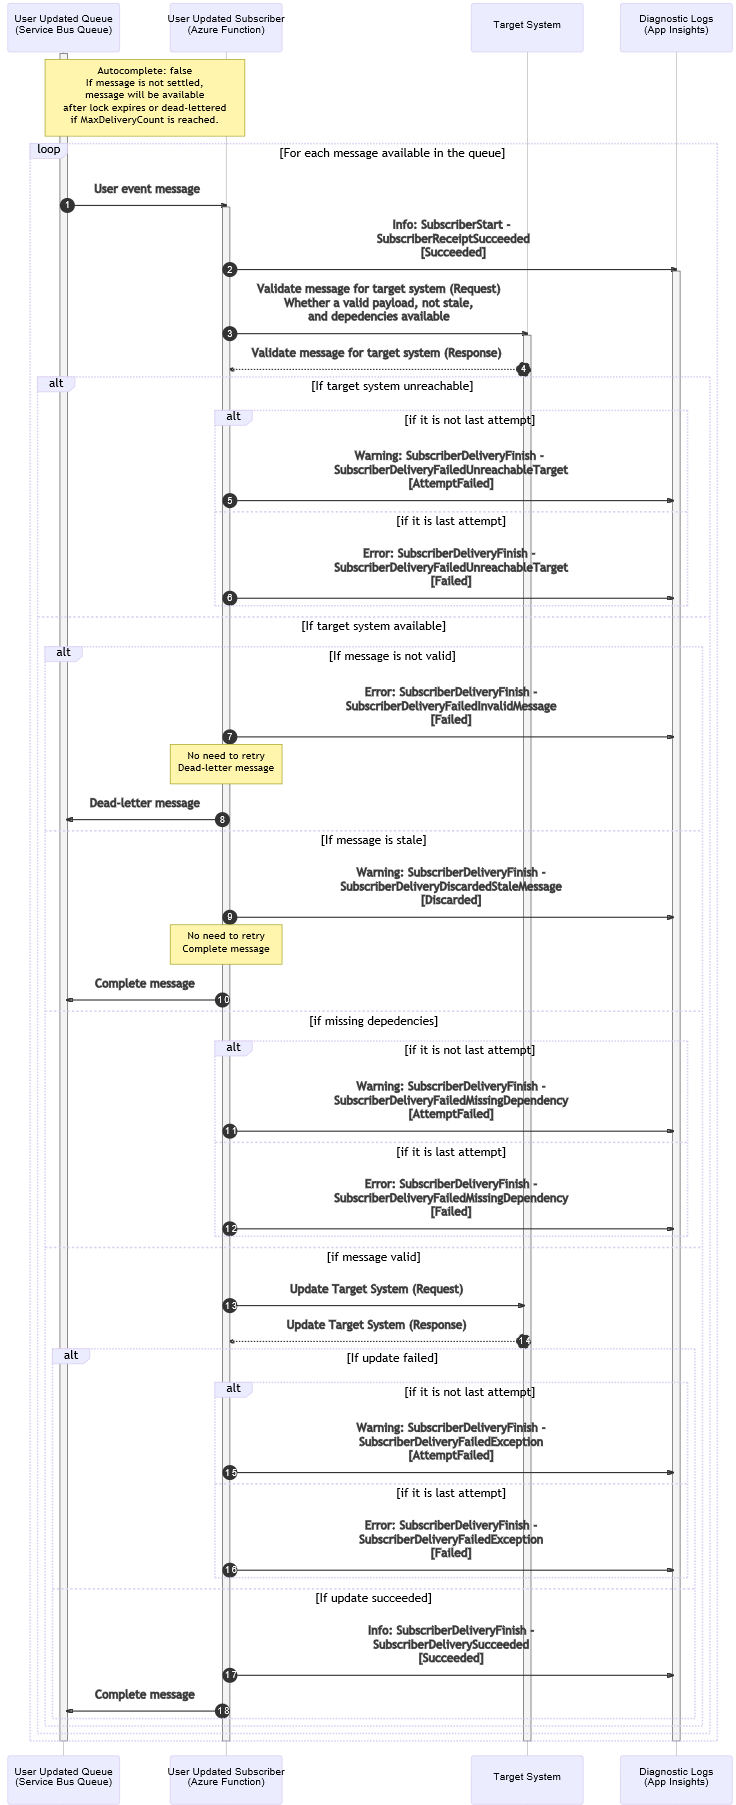
Subscriber Interface Detailed Design
The Subscriber span will be implemented in a subscriber interface. The sequence diagram below depicts the tracing and observability practices in this interface, and includes the participants as follows:
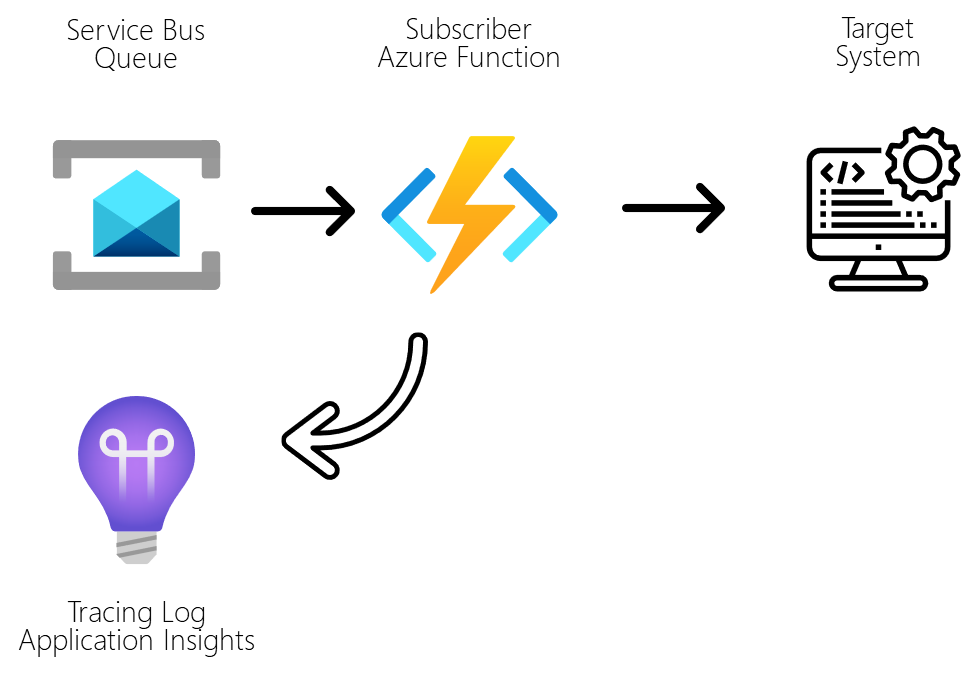
- User Updated Service Bus queue - receives and stores individual user event messages for consumers.
- User Updated Subscriber Azure Function – listens to messages in the queue and subscribes to messages, performs the required validations against the target system - to check whether it is a valid payload, if it is not a stale message, and if all message dependencies are available - tries to deliver the message to the target system, and sends the relevant tracing events to the Diagnostics Logs.
- Target System – any system that needs to get notified when users are updated, but requires an integration layer to do some validation, processing, transformation, and/or custom delivery.
- Diagnostic Logs in Application Insights - captures built-in telemetry and custom tracing produced by the Azure Functions.
As in the previous diagram, tracing log events are depicted using the convention: LogLevel: SpanCheckPointId - EventId [Status].
Wrapping Up
In this post, we have described the design of an approach to meet common observability requirements of distributed services that run in the background using Azure Functions. In the next post of this series, we will cover how this can be implemented and how we can query and analyse the produced tracing events.
Cross-posted on Deloitte Engineering
Follow me on @pacodelacruz