Custom Distributed Tracing and Observability Practices in Azure Functions – Part 3 - Implementation

Introduction
In the previous post of the series, we described the design of an approach to meet common observability requirements of distributed services using Azure Functions. Now, in this post, we are going to cover how this can be implemented and how we can query and analyse the produced tracing logs.
This post is part of a series outlined below:
- Introduction – describes the scenario and why we might need custom distributed tracing in our solution.
- Solution design – outlines the detailed design of the suggested solution.
- Implementation (this) – covers how this is implemented using Azure Functions and Application Insights.
I strongly suggest that you read these posts in sequence, so you understand what the solution presented here is trying to achieve.
Solution Components
The proposed solution is based on the Azure services described below:
|
Component |
Description |
|
Azure Functions |
It contains the publisher and subscriber interfaces with a custom distributed tracing implementation. |
|
Application Insights |
Receives and keeps all distributed tracing logs from the Azure Function. |
|
Storage Account |
Used for request payload archiving. Leveraging the lifecycle management capabilities of Azure Blob Storage to transition or delete archive blobs will allow you to optimise costs or achieve privacy compliance. |
|
Service Bus |
Used to implement temporal decoupling between the publisher and the subscriber interfaces. |
Show me the Code
Now, let’s get deeper into the solution code. The full solution can be found in this GitHub repo, however I will go through some of the key components of the solution in this post. I’ve also added comments to my code, ensuring it’s easy to follow.
Logging Constants
I suggest using constants and enumerations in the tracing implementation to have consistent values across all the components that use them. In this class, I’ve defined all of them.
LoggerExtensions
To ease structured logging using the default ILogger provider in Azure Functions, I’ve created extension methods that provide typed signatures. The different key-value pairs defined in the previous post are being used in these methods.
LoggerHelper
To map tracing event status to the standard ILogger.LogLevel, I’ve created this helper with a method that returns the corresponding LogLevel based on the process status.
Publisher Function (UserUpdatedPublisher)
This is the implementation of the publisher component designed and described in the previous post as an Azure Function. This function receives a HTTP request with user events in the Cloud Events format, splits it into individual events, and sends them to a Service Bus queue.
Subscriber Function (UserUpdatedSubscriber)
This class implements the subscriber component designed and described in the previous post as an Azure Function. This function receives a Service Bus message and simulates the delivery to a target system.
As mentioned above, the full solution can be found in this GitHub repo.
Deploying the Solution
In the GitHub repo, I’ve included the ARM templates, which create all the infrastructure needed to have this up and running. You will also need to build the demo Azure Function solution and deploy it to your Azure Function App. Bear in mind that there might be some costs associated with these resources.
Generating Traffic
You can simulate the webhook calls by using the VS Code REST Client extension and posting HTTP requests. A sample request is as follows.
Querying the Distributed Traces
In the , we listed some of the common requirements that an operations team has when supporting distributed backend services. After a comprehensive design of the tracing approach and its implementation, now we can finally see the benefits in action. We are now able to query our distributed traces in a meaningful way.
Once the Azure Function is running and has logged tracing events, logs in Application Insights can be queried using the Kusto query language. Let’s go through some of the queries I’ve prepared to meet the observability requirements described previously. All of these queries are available in the GitHub repo.
Batch Publisher Span Traces
This query provides the details of all Batch Publisher spans. It correlates the Start and Finish checkpoints and returns the relevant key-value pairs. Traces can be filtered by uncommenting the filters at the bottom of the query and adding the corresponding filter values. For instance, you could filter tracing records related to a particular EntityType and EntityId, InterfaceId, BatchId, etc.
A sample response is as follows:

Correlated Publisher and Subscriber Span Traces
This query returns the correlated traces in the lifespan of an individual message. It correlates the Start and Finish checkpoints of both the Publisher and Subscriber spans and returns the relevant key-value pairs. Traces can be filtered by uncommenting the filters at the bottom of the query and adding the corresponding filter values, as discussed above.
The figures below depict a sample response.


Failed Traces
This query returns traces with a failed status. As in the previous ones, traces can be filtered by uncommenting the filters at the bottom and adding the corresponding filter values.
A sample response is depicted in the figure below.

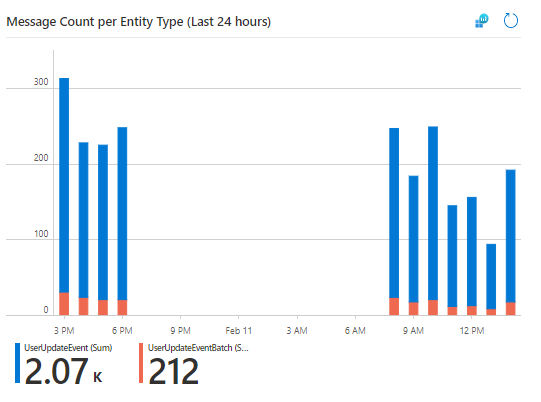
Message Count per Entity Type over Time
This query returns the message count per EntityType over time which can be rendered into a chart as shown below.

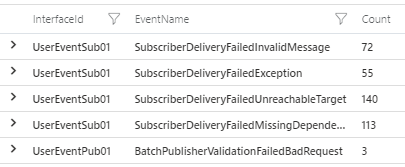
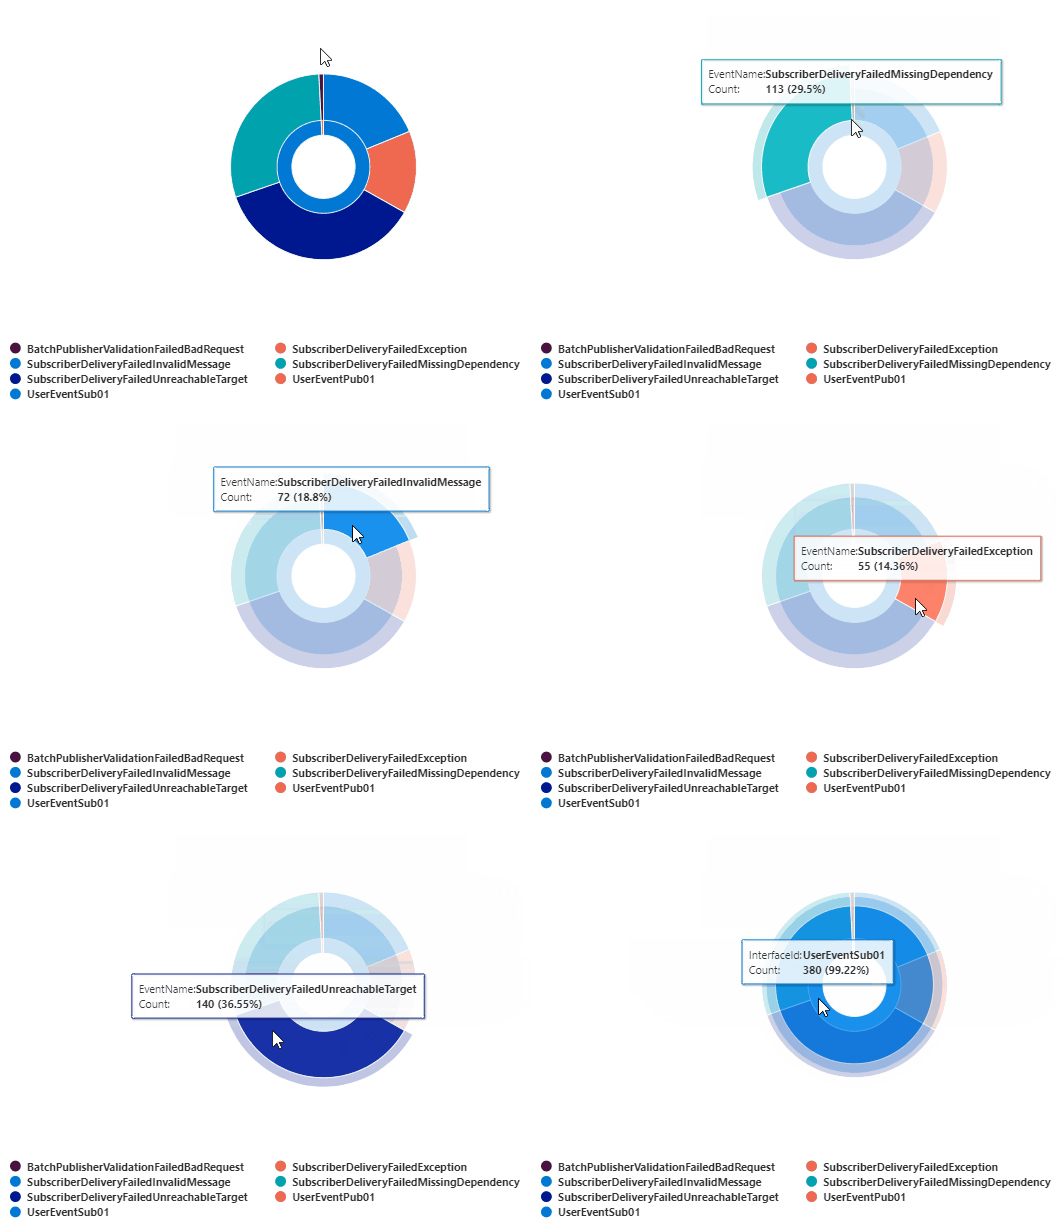
Error Count by InterfaceId and TraceEventId
This query returns the error count grouped by InterfaceId and TraceEventId (EventName). This can be rendered into a pie or doughnut chart.


Considerations
If you are planning to implement this approach in your solution, you need to configure the corresponding logging sampling and log level on your Azure Function according to your needs.
Furthermore, before using this approach, bear in mind the points below:
- There are costs associated with Application Insights for data ingestion and data retention. Depending on the volume of tracing events, this could influence the overall running costs of your solution.
- Tracing data can be lost or sampled. Thus, this tracing strategy must not be utilised for auditing purposes.
- Due to its asynchronous nature, Application Insights cannot guarantee telemetry delivery.
- Application Insights has a daily data cap and throttles the number of requests per second.
- Application Insights also has a sampling configuration on the backend.
- Data retention on Application Insights must be configured based on the requirements.
Wrapping Up
In this post, we’ve covered how we can implement a comprehensive tracing approach in Azure Functions, adding business-related metadata and leveraging their structured logging capabilities. We aimed to meet some of the common observability requirements that operations teams have when supporting distributed backend services.
We used an approach tailored for integration solutions with Azure Functions which follow the publish-subscribe integration pattern and the splitter integration pattern. However, you can leverage similar principles in your own solution.
I hope you’ve found the series useful, and happy monitoring!
Cross-posted on Deloitte Engineering
Follow me on @pacodelacruz


